This notebook demonstrates how to use the various slits in METIS. They are defined in a SlitWheel effect, which works in the same way as FilterWheel. The notebook uses imaging mode to show the slits directly.
[1]:
import scopesim as sim
sim.bug_report()

# Edit this path if you have a custom install directory, otherwise comment it out.
sim.rc.__config__["!SIM.file.local_packages_path"] = "../../../../"
Python:
 3.9.7 (default, Sep 28 2021, 17:45:03)
[GCC 9.3.0]

scopesim :  0.4.0
numpy :  1.22.3
scipy :  1.8.0
astropy :  5.0.1
matplotlib :  3.5.1
synphot :  1.1.1
skycalc_ipy : version number not available
requests :  2.27.1
bs4 :  4.10.0
yaml :  6.0

Operating system:  Linux
         Release:  5.11.0-1019-aws
         Version:  #20~20.04.1-Ubuntu SMP Tue Sep 21 10:40:39 UTC 2021
         Machine:  x86_64
[2]:
from matplotlib import pyplot as plt
%matplotlib inline
If you haven’t got the instrument packages yet, uncomment the following cell.
[3]:
# sim.download_package(["instruments/METIS", "telescopes/ELT", "locations/Armazones"])
[4]:
cmd = sim.UserCommands(use_instrument="METIS", set_modes=['img_lm'])
In imaging mode, "!OBS.slit" is false by default, i.e. there is no slit in the path. However, slits can be used in imaging as well by setting !OBS.slit to one of the slits available in the METIS package.
[5]:
cmd['!OBS.slit'] = "C-38_1"
[6]:
src = sim.source.source_templates.empty_sky()
[7]:
metis = sim.OpticalTrain(cmd)
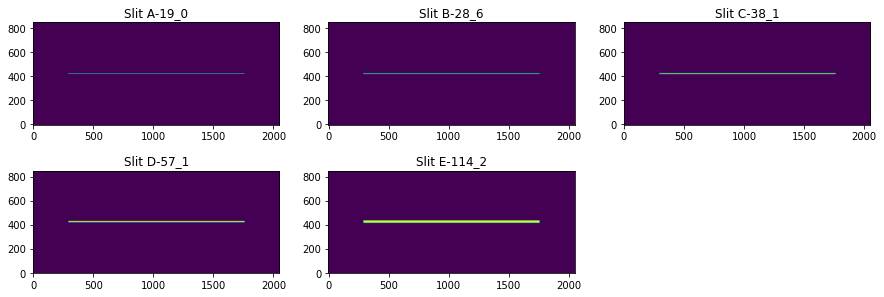
The following slits are now available and can be selected with metis['slit_wheel'].change_slit() as demonstrated below.
[8]:
metis['slit_wheel'].slits
[8]:
{'A-19_0': ApertureMask: "A-19_0",
 'B-28_6': ApertureMask: "B-28_6",
 'C-38_1': ApertureMask: "C-38_1",
 'D-57_1': ApertureMask: "D-57_1",
 'E-114_2': ApertureMask: "E-114_2"}
[9]:
implanes = dict()
for slit in metis['slit_wheel'].slits:
    metis['slit_wheel'].change_slit(slit)
    metis.observe(src, update=True)
    implanes[slit] = metis.image_planes[0].data
[10]:
plt.figure(figsize=(15, 5))
for i, slit in enumerate(metis['slit_wheel'].slits):
    plt.subplot(2, 3, i+1)
    plt.imshow(implanes[slit][600:1450,], origin='lower')
    plt.title("Slit " + slit)